Information
Organism: Schistosoma mansoni Google Scholar
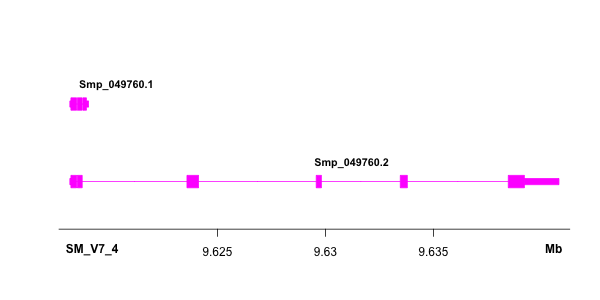
Wide box showing CDS (or exon for non-coding genes) and narrow box showing UTR.
Databases
WormBase Parasite entry for Smp_049760 Gene and Gene Tree
Functions
Conserved Domain(s): GS, PKc_like, Pkinase, SPS1, STKc_TGFbR1_ACVR1b_ACVR1c, S_TKc, TGF_beta_GS, TOMM_kin_cyc, pknD (Check domains Biological Process Molecular Function K04674 Orthologs in other organisms AGE-RAGE signaling pathway in diabetic complications, Adherens junction, Apelin signaling pathway, Cellular senescence, Chagas disease (American trypanosomiasis), Chronic myeloid leukemia, Colorectal cancer, Cytokine-cytokine receptor interaction, Endocytosis, FoxO signaling pathway, HTLV-I infection, Hepatitis B, Hippo signaling pathway, MAPK signaling pathway, Osteoclast differentiation, Pancreatic cancer, Pathways in cancer, Relaxin signaling pathway, TGF-beta signaling pathway, Th17 cell differentiation (Details
Gene Expression
Normalised expression of this gene in different life stages, by single-sex or mixed-sed infections, as analysed from published RNAseq studies. More information
Data from mixed-sex infections Created with Highcharts 12.3.0 Normalised expression Chart context menu Smp_049760 Gene expression throughout life stages (mixed-sex infection) Te: 26.55 Te: 26.55Egg: 10.94 Egg: 10.94Mir: 39.04 Mir: 39.04Spo: 42.23 Spo: 42.23Cerc: 35.46 Cerc: 35.46Som3h: 46.81 Som3h: 46.81Som24h: 68.97 Som24h: 68.97m21d: 33.65 m21d: 33.65m28d: 32.21 m28d: 32.21m35d: 29.69 m35d: 29.69m38d: 31.37 m38d: 31.37m42d+: 25.11 m42d+: 25.11Ov: 30.52 Ov: 30.52Egg: 10.94 Egg: 10.94Mir: 39.04 Mir: 39.04Spo: 42.23 Spo: 42.23Cerc: 35.46 Cerc: 35.46Som3h: 46.81 Som3h: 46.81Som24h: 68.97 Som24h: 68.97f21d: 32.89 f21d: 32.89f28d: 30.76 f28d: 30.76f35d: 24.73 f35d: 24.73f38d: 17.07 f38d: 17.07f42d+: 16.96 f42d+: 16.96Male Female Gonad Egg Mira Sporo Cerc Somule 3h Somule 24h Juvenile 21d Juvenile 28d Adult 35d Adult 38d Adult >42d 20 40 60 Lu et al (2018)
Data from single-sex infections Created with Highcharts 12.3.0 Normalised expression Chart context menu Smp_049760 Gene expression throughout life stages (single-sex infection) Egg: 10.94 Egg: 10.94Mir: 39.04 Mir: 39.04Spo: 42.23 Spo: 42.23mCer: 23.44 mCer: 23.44mSo1: 37.14 mSo1: 37.14mSo2: 28.12 mSo2: 28.12mSo3: 33.63 mSo3: 33.63m18d: 37.44 m18d: 37.44m21d: 34.09 m21d: 34.09m28d: 32.26 m28d: 32.26m35d: 26.35 m35d: 26.35m38d: 26.90 m38d: 26.90m42d+: 19.74 m42d+: 19.74Egg: 10.94 Egg: 10.94Mir: 39.04 Mir: 39.04Spo: 42.23 Spo: 42.23fCer: 27.72 fCer: 27.72fSo1: 32.21 fSo1: 32.21fSo2: 36.91 fSo2: 36.91fSo3: 34.00 fSo3: 34.00f18d: 30.18 f18d: 30.18f21d: 36.71 f21d: 36.71f28d: 41.30 f28d: 41.30f35d: 33.72 f35d: 33.72f38d: 35.36 f38d: 35.36f42d+: 23.40 f42d+: 23.40Male Female Egg Mira Sporo Cerc Somule #1 Somule #2 Somule #3 Juvenile 18d Juvenile 21d Juvenile 28d Adult 35d Adult 38d Adult >42d 10 20 30 40 Lu et al (2018)
