Information
Organism: Schistosoma mansoni Google Scholar
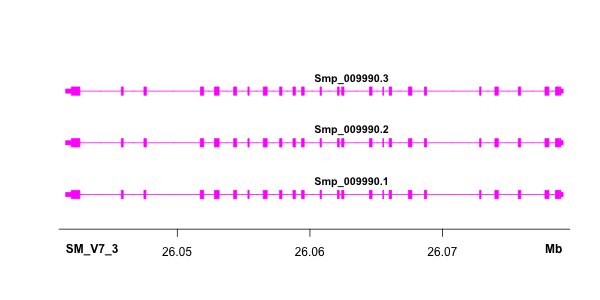
Wide box showing CDS (or exon for non-coding genes) and narrow box showing UTR.
Databases
WormBase Parasite entry for Smp_009990 Gene and Gene Tree
Functions
Conserved Domain(s): FN3, FU, Furin-like, PKc_like, PTKc_InsR_like, PTZ00267, Pkinase, Pkinase_Tyr, Recep_L_domain, SPS1, STYKc, fn3 (Check domains Biological Process Molecular Function K05087 Orthologs in other organisms AMPK signaling pathway, Adherens junction, Autophagy - animal, Breast cancer, EGFR tyrosine kinase inhibitor resistance, Endocrine resistance, Endocytosis, Focal adhesion, FoxO signaling pathway, Glioma, HIF-1 signaling pathway, Long-term depression, Longevity regulating pathway, Longevity regulating pathway - multiple species, Melanoma, Oocyte meiosis, Ovarian steroidogenesis, PI3K-Akt signaling pathway, Pathways in cancer, Progesterone-mediated oocyte maturation, Prostate cancer, Proteoglycans in cancer, Rap1 signaling pathway, Ras signaling pathway, Signaling pathways regulating pluripotency of stem cells, Transcriptional misregulation in cancer, mTOR signaling pathway (Details
Gene Expression
Normalised expression of this gene in different life stages, by single-sex or mixed-sed infections, as analysed from published RNAseq studies. More information
Data from mixed-sex infections Created with Highcharts 12.3.0 Normalised expression Chart context menu Smp_009990 Gene expression throughout life stages (mixed-sex infection) Te: 11.92 Te: 11.92Egg: 22.03 Egg: 22.03Mir: 16.91 Mir: 16.91Spo: 15.72 Spo: 15.72Cerc: 35.71 Cerc: 35.71Som3h: 29.87 Som3h: 29.87Som24h: 32.58 Som24h: 32.58m21d: 15.47 m21d: 15.47m28d: 13.73 m28d: 13.73m35d: 12.96 m35d: 12.96m38d: 14.48 m38d: 14.48m42d+: 17.04 m42d+: 17.04Ov: 15.24 Ov: 15.24Egg: 22.03 Egg: 22.03Mir: 16.91 Mir: 16.91Spo: 15.72 Spo: 15.72Cerc: 35.71 Cerc: 35.71Som3h: 29.87 Som3h: 29.87Som24h: 32.58 Som24h: 32.58f21d: 15.03 f21d: 15.03f28d: 12.47 f28d: 12.47f35d: 9.19 f35d: 9.19f38d: 9.37 f38d: 9.37f42d+: 11.43 f42d+: 11.43Male Female Gonad Egg Mira Sporo Cerc Somule 3h Somule 24h Juvenile 21d Juvenile 28d Adult 35d Adult 38d Adult >42d 10 20 30 Lu et al (2018)
Data from single-sex infections Created with Highcharts 12.3.0 Normalised expression Chart context menu Smp_009990 Gene expression throughout life stages (single-sex infection) Egg: 22.03 Egg: 22.03Mir: 16.91 Mir: 16.91Spo: 15.72 Spo: 15.72mCer: 24.90 mCer: 24.90mSo1: 20.01 mSo1: 20.01mSo2: 17.59 mSo2: 17.59mSo3: 23.76 mSo3: 23.76m18d: 14.29 m18d: 14.29m21d: 15.44 m21d: 15.44m28d: 13.63 m28d: 13.63m35d: 12.93 m35d: 12.93m38d: 13.92 m38d: 13.92m42d+: 19.54 m42d+: 19.54Egg: 22.03 Egg: 22.03Mir: 16.91 Mir: 16.91Spo: 15.72 Spo: 15.72fCer: 28.78 fCer: 28.78fSo1: 18.58 fSo1: 18.58fSo2: 19.95 fSo2: 19.95fSo3: 18.86 fSo3: 18.86f18d: 12.10 f18d: 12.10f21d: 16.96 f21d: 16.96f28d: 13.29 f28d: 13.29f35d: 11.63 f35d: 11.63f38d: 13.39 f38d: 13.39f42d+: 17.87 f42d+: 17.87Male Female Egg Mira Sporo Cerc Somule #1 Somule #2 Somule #3 Juvenile 18d Juvenile 21d Juvenile 28d Adult 35d Adult 38d Adult >42d 15 20 25 Lu et al (2018)
